Before we analyze the tempdb impact, I want to talk about how to use the tools to perform the analysis. There are a series of great software tools that I use and need to be installed on your servers in order to efficiently log the process. Not only do these tools to a good job logging activity, they also provide an amazing analysis interface.
I will list the tools out and where to get them, but as part of this post I will not walk you through how to install them and cannot guarantee version compatibility with your system. Again, we will go through the actual impact in an upcoming blog post.
Below are the tools
PAL (Performance Analysis of Logs) Tool
http://pal.codeplex.com/
http://pal.codeplex.com/
Powershell version 2.0
RML Utilities: Used in house by Microsoft support engineers to diagnose customer support issues.
Microsoft Report Viewer distributable
http://www.microsoft.com/download/en/details.aspx?id=6576
http://www.microsoft.com/download/en/details.aspx?id=6576
Log Parser: Allows querying against log, xml, csv and other windows files.
http://www.microsoft.com/download/en/details.aspx?id=24659
http://www.microsoft.com/download/en/details.aspx?id=24659
Performance Dashboard Reports: SSRS Reports used to monitor sql server from within management studio.
http://www.microsoft.com/download/en/details.aspx?id=22602
http://www.microsoft.com/download/en/details.aspx?id=22602
MSChart.exe: Utility for providing additional charting functionality.
http://www.microsoft.com/download/en/details.aspx?id=14422
http://www.microsoft.com/download/en/details.aspx?id=14422
PSSDIAG: Diagnostic utility to collection perfmon logs, sysmon logs, profiler traces, event logs.
http://www.microsoft.com/download/en/details.aspx?amp;amp;amp;amp;amp;amp;amp;DisplayLang=en&id=11886
http://www.microsoft.com/download/en/details.aspx?amp;amp;amp;amp;amp;amp;amp;DisplayLang=en&id=11886
Onto the fun part. How to use the tools.
The first step in the collection process is starting PSSDiag.exe. For those of you, who are trying to do this as well in your environment, look for that executable in the directory where the install placed it, and run that executable as an administrator.
All you do to start it is just double click it. The executable will launch a command prompt that will generate several messages. The command prompt prints a message to the screen once it has finished initializing, signaling that it’s ready for testing. Below is the output generated from my when I clicked on the PSSDIAG.exe.
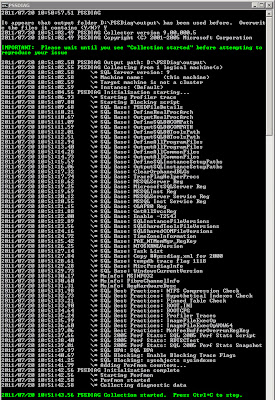
All you do to start it is just double click it. The executable will launch a command prompt that will generate several messages. The command prompt prints a message to the screen once it has finished initializing, signaling that it’s ready for testing. Below is the output generated from my when I clicked on the PSSDIAG.exe.

After starting PSSDiag, fire up something you want to monitor. I fired up the good ol' PRSummary build in Vision as my example. Based on the amount of data we have and the fact I was testing this on a dev box, our build takes anywhere between 20 and 40 minutes to complete.
Once your process you are monitoring finishes, hit Control + C in the command prompt which will stop PSSDiag. If you are running this for the first time, don't forget to do this, otherwise the collection process will eventually exhaust your disk space. One additional note, please remember to rename the output folder so that you can save your results without them being overwritten the next time PSSDIag is started.
So, I may have gotten ahead of myself, but all of the collection output and analysis files are stored into a folder called output within the PSSDiag installation directory. If you want to use the PAL tool, you will need to locate the .BLG file. This is the file you will open using the PAL tool.
Onto the PAL tool.
The PAL Tool assumes that you have a database name PerfAnalysis installed on your database server. I can't remember if the installation process created this or if I had to create this manually. Obviously, If you do not have one, you will need to create an empty database named PerfAnalysis. I
If you have installed PAL, it usually writes itself into the program files\PAL\ directory on your OS drive. Locate the PALWizard.exe and launch it.
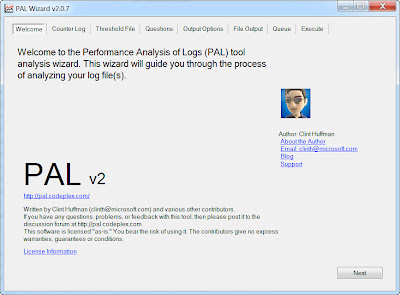
The PAL tool will walk you through a wizard type interface. The most important items to fill out are below. For simplicity, I will not share all of my server details with you.
1. Find the .BLG file in the output folder and use that for the counter log file path.
2. Threshold file title is the version of SQL Server that you are on.
3. Number of processors the SQL Server has that you performed your PSSDiag on.
4. If the 3GB switch is enabled on your SQL Server.
5. If your Server is 32 or 64 Bit.
6. How much memory you have on the server dedicated to SQL Server.
7. Next, next, next....finish.
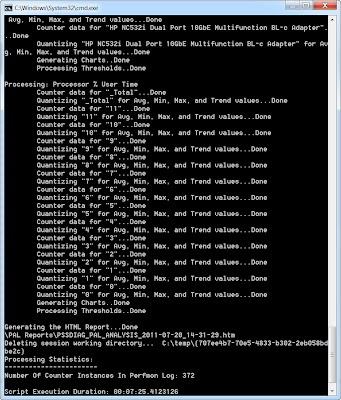
After clicking finish, there will be another command prompt launched which will give you the status of the output that PAL creates. PAL will create an HTM file that it will place in the PAL installation directory. This process will take several minutes and will increase in time depending on the size of your collection.
PAL produces an html file with several stats, charts and summaries. At the top of the web page, there are alerts by chronological order and by type of alert that allow you to drill down into the html file.
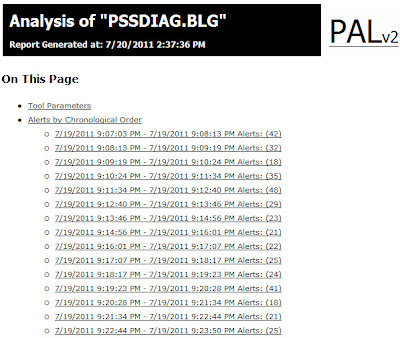
When drilling down, you will see something like the following.
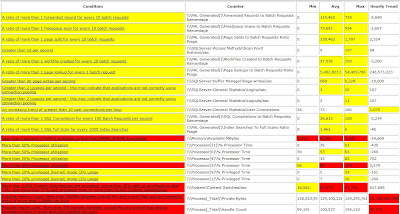
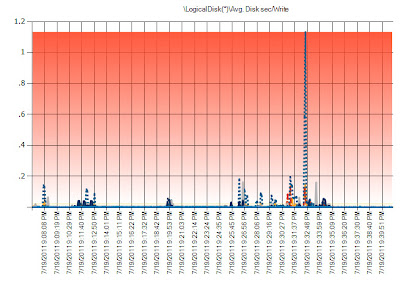
Like I mentioned before, there are charts as well.
RML is an additional type of utiltiy that Microsoft uses in house for testing. To fire up RML, launch the RML command prompt. It will be somewhere in your system tray or start menu.

The PAL tool will walk you through a wizard type interface. The most important items to fill out are below. For simplicity, I will not share all of my server details with you.
1. Find the .BLG file in the output folder and use that for the counter log file path.
2. Threshold file title is the version of SQL Server that you are on.
3. Number of processors the SQL Server has that you performed your PSSDiag on.
4. If the 3GB switch is enabled on your SQL Server.
5. If your Server is 32 or 64 Bit.
6. How much memory you have on the server dedicated to SQL Server.
7. Next, next, next....finish.
After clicking finish, there will be another command prompt launched which will give you the status of the output that PAL creates. PAL will create an HTM file that it will place in the PAL installation directory. This process will take several minutes and will increase in time depending on the size of your collection.

PAL produces an html file with several stats, charts and summaries. At the top of the web page, there are alerts by chronological order and by type of alert that allow you to drill down into the html file.

When drilling down, you will see something like the following.

Like I mentioned before, there are charts as well.

RML is an additional type of utiltiy that Microsoft uses in house for testing. To fire up RML, launch the RML command prompt. It will be somewhere in your system tray or start menu.
Type the following command in your RML prompt:
readtrace -IDriveLetter:\outputdirectory\nameofyourtracefile.trc -oDriveLetter:outputdirectory\yourchoiceoffilename
For example, my command was:
readtrace -ID:\Vision61Summary-output\Vision_sp_trace.trc -oD:\
Vision61Summary-output\Vision_PRSummaryOUTPUT

By clicking on the interesting events link, you will get an nice high level view of events that should be looked at.

Now that we have walked through the tools involved in capturing and analyzing output, this is probably a good place to finish this part of the post. Any further, and we will be entering the analysis of the PRSummary build.
I will follow up in a few days with a second post analyzing what I found in the output. Stay tuned and enjoy.